NOTE: Every week I write a Client Note for my clients. For a limited time, I am allowing non-clients to sign up and receive the Client Note. You can sign up at the top right hand corner of the website. I will also be posting the notes on my blog with a 24-48 hour delay from time to time. Here is this week’s.
*****
I read a compelling bullish piece in the most recent Barron’s yesterday (
“A Really Different Rally, Again”, Michael Santoli,
Barron’s, December 12). One of Santoli’s sources, a guy who correctly predicted the recession in November 2007 and then turned bullish in late April of this year, is still bullish on the market.
According to Santoli, his most recent missive from last Monday was titled “Ready to Breakout” and argues that the markets recent stall around 1100 is not the end of the rally. In it, he calls for S&P 1200-1250 by mid-January.
Most of the bullish stuff I read leaves me unmoved but this piece was persuasive. It got me thinking: What If I’m Wrong?
*****
There are two ways in which I could be wrong. One, I could be wrong about the magnitude and duration of a cyclical bull market. That is, even if I am right that this is only a cyclical bull market within the overall context of a secular bear market, it could run longer and higher than I expect. (For what a secular bear market is, see
“Top Gun FP Client Note: A Secular Bear Market”, July 7, 2009).
1200-1250, even 1300, would not be out of the question in this scenario. 1300 would represent about a 100% move off the lows but would still be well below the 2007 highs.
Two, I could be completely wrong in believing that we are in a secular bear market. It is at least conceivable that this is the start of a new, sustainable, multi-year bull market driven by improving economic fundamentals that will take US stock markets to new all time highs.
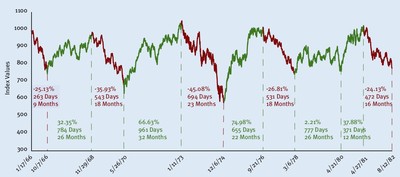
In the first scenario, the costs of being wrong are fairly low. That’s because as of today’s close, the S&P is already up 66% from its March lows. During the last secular bear market, from 1966-1982, the Dow Jones had a number of cyclical bull markets within it, including a 67%, 32 month run in the early 1970s and a 75%, 22 month move in the mid 1970s.
If that market period is a model for the current one, most of the current rally is already in the rearview mirror. The rally could run longer and higher – but not much.
Under the second scenario, a genuine, secular character change in the market driven by improving economic fundamentals, the costs of being wrong could be quite high. This kind of bull market should take US stock markets to new all-time highs in the next few years, blowing through the old all time high around 1575 in the S&P 500.
However, I find this scenario to be highly improbable given the economic backdrop.
The key piece of data on this score is continuing top line weakness. During the most recent 3rd quarter earnings season, revenue for all S&P 500 companies fell by 10%, according to
The Wall Street Journal (see
“U.S. Earnings Are Strong, But Not Sales”, Tom Lauricella,
The Wall Street Journal, November 18). That’s off the already depressed levels of the 3rd quarter of 2008.
Earnings growth is the mother’s milk of bull markets and it is impossible to grow earnings over a long stretch of time without growing revenues. Cost cutting and improved efficiency can only take you so far. And so far, while revenues are stabilizing somewhat at depressed levels, there is no sign of significant top line growth.
Until there is, I remain convinced that this rally is a cyclical bull market. It wouldn’t surprise me at all if it continued to run for many more months but history suggests the big money has already been made.
*****
This week is the last with significant earnings and economic news for the year. After Friday, most will be taking off for the Holiday Season and New Year, and volumes will drop off until Monday January 4, 2010.
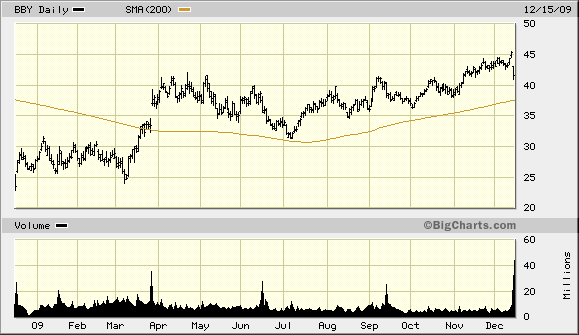
This morning Best Buy (BBY) reported fiscal year 3rd quarter earnings and I scrutinized the report for any clues it could give me about consumer spending and the economy.
U.S. same store sales broke a 4-quarter string of negative numbers, coming in at +4.8% for the 3-month period ended November 28, 2009. A big reason for that was the -6.3% decline in the comparable quarter ended November 29, 2008. That was a very tough period for the economy, and spending at Best Buy dropped off dramatically. Still the +4.8% number puts this just completed quarter only 2% below the peak quarter two years ago.
Same store sales for November were up 8.4% from the year ago period, including a double digit increase for the Friday and Saturday following Thanksgiving. All in all, this is a positive number.
However, investors appeared to focus on the gross margin driving Best Buy shares down 8.5% on big volume. Gross margin came in at 24.5% compared to the year ago quarters 24.9%. That amounts to about $50 million. However, the improved top line combined with tight cost management which cut their Selling, General & Administrative costs from 22.5% to 21.3% of revenues resulted in strong earnings of 53 cents a share, compared to Wall Street estimates for 43 cents and last year’s 35 cents.
The company also forecast a lower than expected gross margin rate for the fiscal 4th quarter.
In sum, Best Buy’s report suggests stabilization and even some improvement in consumer spending, though consumers are very price conscious and buying lower margin items.
Top Gun has a moderate short position in shares of Best Buy and I continue to hold those.
YTD Returns (through 12/11)
S&P: +22.49%
DJ Total: +24.84%
Top Gun: +7.42%
Greg Feirman
Founder & CEO
A Registered Investment Advisor
9700 Village Center Dr. #50H
Granite Bay CA 95746
(916) 224-0113
CALL NOW FOR A FREE INITIAL CONSULTATION!


