NOTE: Every week or two I write a Client Note for my clients. For a limited time, I am allowing non-clients to sign up and receive it at the same time as my clients. You can sign up at the top right hand corner of the website. I will also be posting the notes on my blog with a time delay from time to time.
Originally sent to clients May 1.
*****
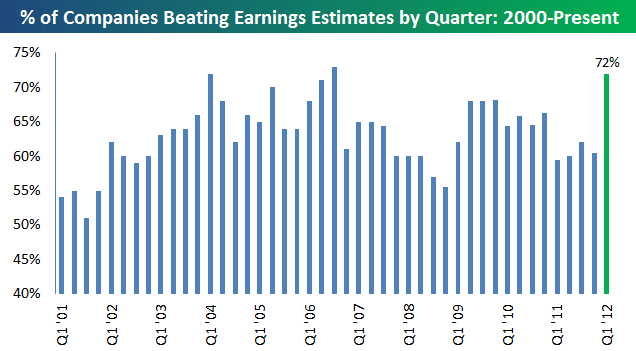
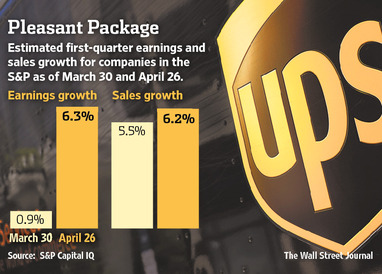
Everybody is talking about how good 1st quarter earnings have been. About 70% of companies have beaten analyst estimates – above the historical average. Earnings are up 6% compared to analyst estimates at the beginning of the season for up 1%.
However, despite the bottom line number, a look beneath the surface of many reports shows a low quality of earnings. In
“A Preview Of 1st Quarter Earnings” (April 3), I showed how gross margin pressure squeezed Nike’s earnings and that only a huge buyback made the quarter look good.
More recently, what looked like a good
1st quarter from IBM two weeks ago on further inspection conceals more than it reveals. IBM’s 1st quarter EPS was up 15% to $2.78, handily beating analyst estimates of $2.65. A closer look, however, shows that none of this growth was from improvement in the underlying business.
Flat revenues resulted in a 3% increase in pre-tax income. Indeed, hardware revenues were down 6.7%. Only a lower tax rate (20.6% versus 25.0% in the year ago period) caused net income to be up 9%. A huge buyback which reduced diluted shares outstanding by more than 5% translated into a 15% increase in EPS. Using the same 25% tax rate as the year ago period, IBM’s EPS would have been $2.63 – 2 cents below analyst estimates. Underneath the financial engineering is a flat quarter.
Even so, after a correction in reaction to earnings, IBM’s shares are now trading above where they were before reporting.
The big standout as usual was Apple (AAPL). Last Tuesday, the juggernaut reported that they sold 35 million iPhones and 12 million iPads in the 1st quarter resulting in a $11.6 billion profit. The company continues to defy expectations that they can’t keep this up and will fall back to earth.
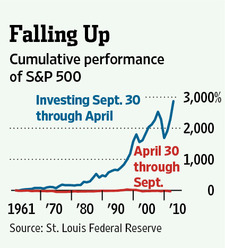
In addition to the other headwinds I have reviewed in previous Client Notes, we are now entering the seasonally weakest part of the year for stocks. For whatever reason, all of the S&P’s gains in the last 50 years have occurred from October through April. Stocks have actually dropped, on average, from May through September over that time period (
“A Summer Rally Really Would Mean A Lot”, Justin Lahart,
The Wall Street Journal, Monday April 30, C8). While this seems irrational, I can tell you from experience that seasonality does count for something on Wall Street as we learned in last year’s 4th quarter (
“The Case For A 4th Quarter Rally”, October 3, 2011).


Greg Feirman
Founder & CEO
A Registered Investment Advisor
9700 Village Center Dr. #50H
Granite Bay CA 95746
(916) 224-0113
CALL NOW FOR A FREE INITIAL CONSULTATION!


