NOTE: Every week or two I write a Client Note for my clients. For a limited time, I am allowing non-clients to sign up and receive it at the same time as my clients. You can sign up at the top right hand corner of the website. I will also be posting the notes on my blog with a time delay from time to time.
Originally sent to clients March 5.
*****
Complacency often sets in when the market is making small and persistent gains like it is now. Environments like this can persist, but when a selloff occurs it can be shocking and the drops are often relatively large.
Last week we made nominal new bull market highs. The S&P hit 1378 at the open on Tuesday before closing the week at 1370.
I remember when the same thing happened in 2007. The market peaked out in mid-July with highs at 1555. After a nasty correction, the market reversed course and made nominal new highs in October before the bear market began in earnest.
The reason the previous highs have so much power has to do with technical analysis. Everybody knows that 1370 is the high from last April/May. Traders see a breakout as confirmation of the bull market while a failure could be interpreted as a double top. Therefore, everybody is fixated on what the market is going to do here.
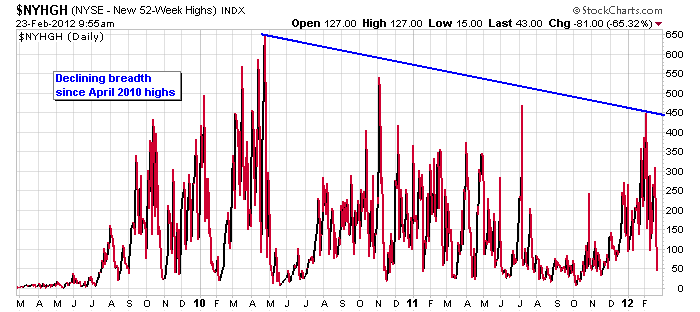
However, even though we are back at previous highs, the market’s internal strength is not as good as it was last year. The number of new NYSE highs has declined at every market peak during this bull market since April 2010. Then, about 650 NYSE stocks – out of a little more than 3,000 – made new 52-week highs. That November the number was just under 550. Finally, at this February’s point of highest momentum, only 450 NYSE stocks made new highs. What this means is that fewer and fewer stocks are leading the market higher. Conversely, more and more are failing to participate in the rally.
For example, did you know that Caterpillar (CAT) accounted for 166 of the Dow’s 760 point 2012 gain (22%) through Friday? Include IBM and United Technologies (UTX) and you’ve accounted for 48% of the Dow’s year-to-date gains. The most important leading stock – and now the biggest – is Apple (AAPL), up 35% on the year through Friday. Remove these leading stocks and the rest of the market is not doing nearly as well as the large indexes would suggest.
One example of declining breadth that is starting to get more attention is the laggard Russell 2000 index of small cap stocks. Indeed, while the S&P managed to squeak out a small gain last week, the Russell dropped 3%.
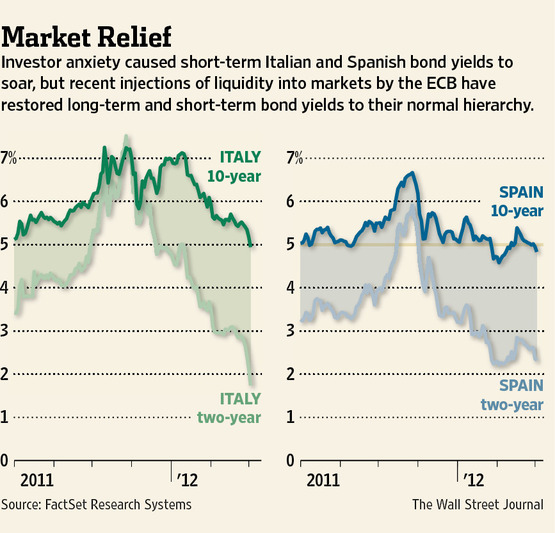
The big event last week was the ECB’s Long Term Refinancing Operation (LTRO) II. This is the ECB’s attempt to support Europe’s banks and sovereign governments (see
“Europe’s Bond Sales Mark ECB Success Story”,
The Wall Street Journal, March 2, C1). Add the €529 billion taken up last Wednesday to the €489 billion in December and the ECB has injected more than €1 trillion in to the banking system in the last 3 months. No wonder European sovereign bond yields have come down. This is the European version of Quantitative Easing.
One consequence, however, is the rise in oil prices. Oil is now at $107/barrel causing me to pay $4.379/gallon to fill up my car on Saturday at a Shell station in San Carlos, CA. Oil is a cost to consumers and businesses, squeezing other discretionary spending and profit margins. John Burbank, head of San Francisco’s Passport Capital hedge fund, spoke about the causes and consequences of higher oil prices two Fridays ago on Bloomberg.
Today belongs to the short term traders trying to squeeze every last dollar out of this move. The day after tomorrow belongs to the bears.
Greg Feirman
Founder & CEO
A Registered Investment Advisor
9700 Village Center Dr. #50H
Granite Bay, CA 95746
(916) 224-0113
CALL NOW FOR A FREE CONSULTATION!


