The Most Overvalued Market In History, Mutual Fund Cash & Insider Buying, Inside Tuesday, KMX Earnings
Note: To sign up to be alerted when the morning blog is posted to my website, enter your name and email in the box in the right hand corner titled “New Post Announcements”. That will add you to my AWeber list. Each email from AWeber has a link at the bottom to “Unsubscribe” making it easy to do so should you no longer wish to receive the emails.
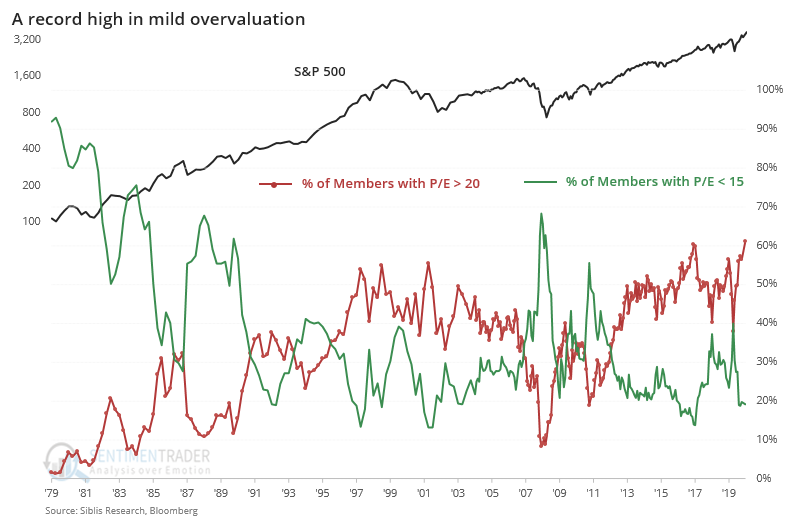
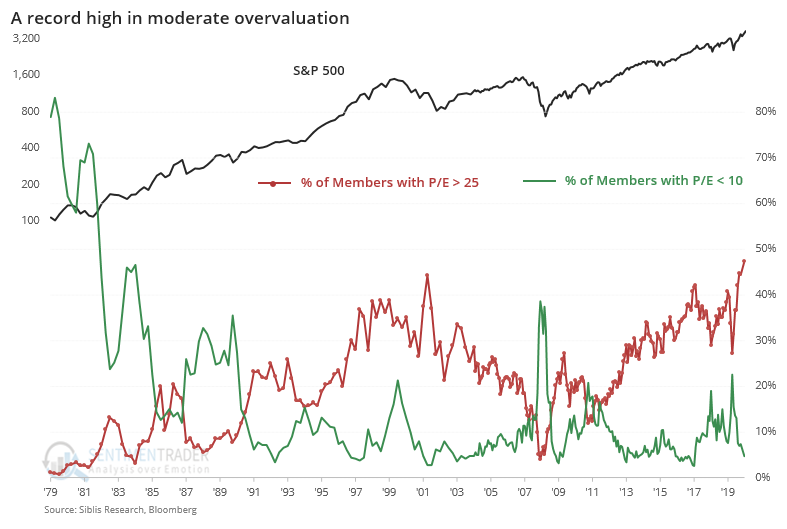
As usual, Sentimentrader had a number of great data points yesterday. In their blog post “Daily Report: A new record in severely overvalued companies” [SUBSCRIPTION REQUIRED], they looked at S&P valuation across time from the standpoint of mild (P/E > 20), moderate (P/E > 25) and severe overvaluation (P/E > 30) (Note: Money losing companies are NOT included so it’s even worse than this).
Starting with mild overvaluation (P/E > 20), ~60% of S&P components qualify, surpassing the highs from 2017 and 2000.
Same for moderate valuation (P/E > 25) which is approaching 50%.
And, drum roll please, nearly 40% of S&P components, even excluding those who lose money, are severely overvalued (P/E > 30). Here’s what Sentimentrader had to say about that: “When we focus on severe valuations, with a P/E above 30, there has never been anything like what we’re seeing now. Nearly 40% of companies are currently sporting a valuation that high, and that’s excluding the many companies that currently have negative earnings.”
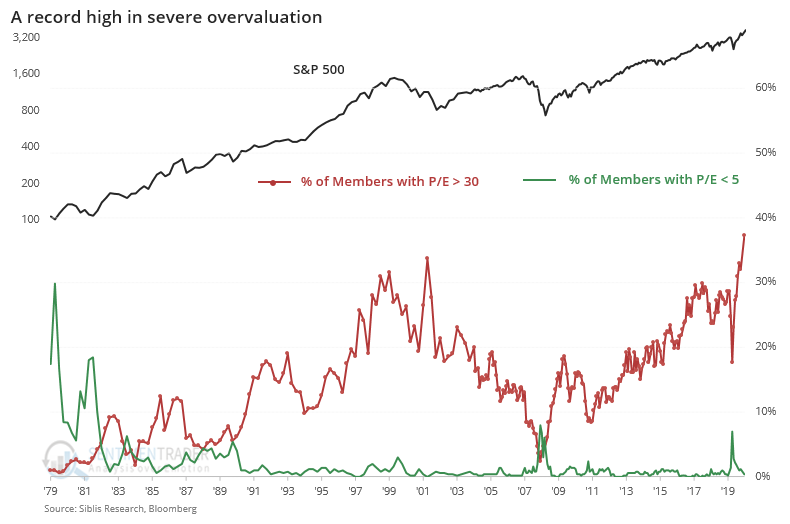
“There has never been anything like what we’re seeing now”: Folks: This is the most overvalued market in history – more so than 2000 and more so than 1929.
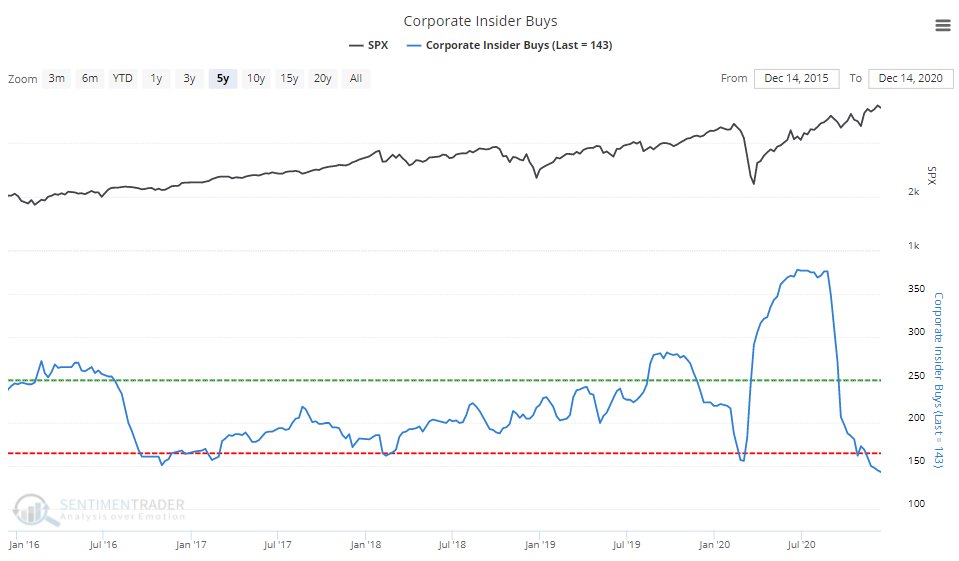
No wonder corporate insiders have no interest in buying their own stock (Chart Source: Sentimentrader Twitter, Saturday December 19).
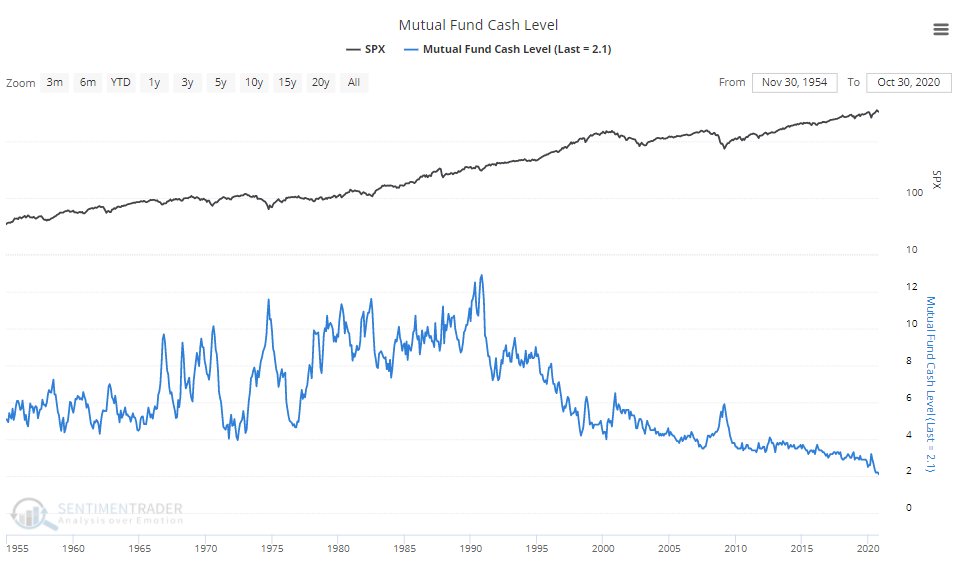
However, the buy side is All-In, including mutual funds whose cash levels are now 2% – the lowest in history (Chart Source: Sentimentrader Twitter, Saturday December 19).
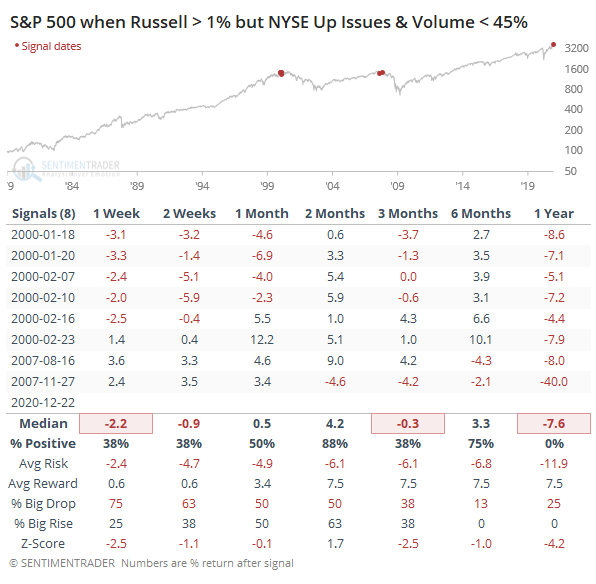
Sentimentrader also noted what an odd trading day yesterday (Tuesday 12/22) was. While the Russell 2000 was +0.99%, NYSE advancing breadth and volume were < 45%. That’s quite odd because the stocks in the Russell 2000 dominate the large and medium caps on the NYSE as far as quantity so you don’t expect to see it having such a good day in conjunction with poor breadth.
They went further and looked at what happened in the past going forward when the Russell is up > 1% and NYSE advancing breadth and volume is < 45%. It turns out that it’s only happened 8 times since 1979 – six times in early 2000 and twice in late 2007 (Chart Source: Sentimentrader, “Daily Report: A new record in severely overvalued companies”, December 22). We all know what happened next in those two cases.
I’m not going to make a huge deal out of one trading day in late December but it did catch my eye.
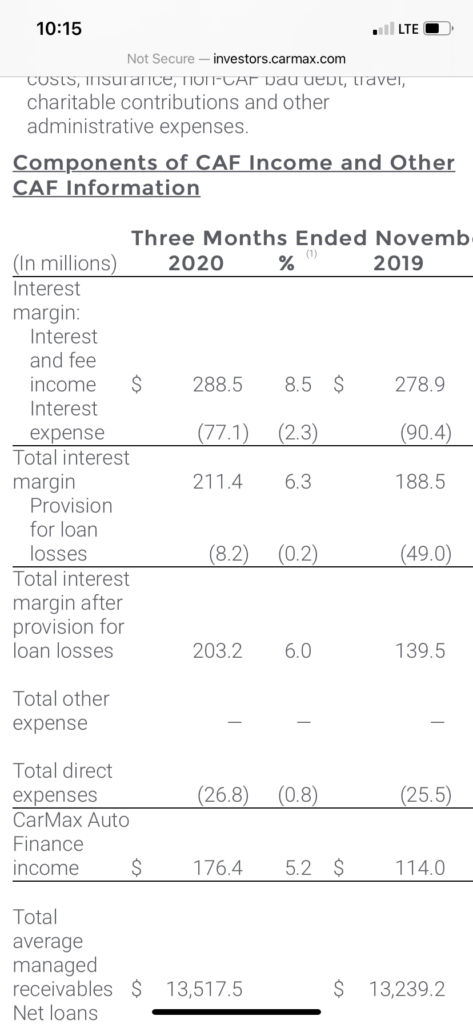
Last, let’s take a look at Carmax (KMX, $15 billion market cap) earnings from yesterday morning for the quarter ended Nov 30, 2020 (Source: KMX 3QFY21 Earnings Release, December 22). On the surface, it was a good quarter with Revenue +8% and EPS +37% – though used vehicle comps were -0.8%. So why did the stock plummet 8.09% on more than 5x average volume – by far the most of any day in the last 12 months?

The reason, I believe, is that a look beneath the hood reveals that all of the increase in Net Income came from their finance division, not from selling cars. A look at the table below shows that Interest and Fee Income was up ~$10 million while Interest Expense was down ~$13 million. Biggest of all, Provision for Loan Losses was down ~$41 million. Add it all up and you get $64 million – almost exactly equal to KMX’s $62 million increase in overall Net Income for the quarter. In other words, the interest rate and overall economic environment underlies the apparently strong quarter, not their business of selling cars.
Probably no morning blog tomorrow (Thursday December 24, Christmas Eve) and definitely not one Friday so you’ll next hear from me Monday morning. Happy Holidays Everyone!
