The Likely Narrative Through Year End, The Bear Market Rally of 1929-30, Historic Overvaluation
The vaccine announcement has given bullish investors a put option – Jim Paulsen, CIO, The Leuthold Group on “The Vaccine Put”, quoted in Ben Levishon, Barron’s, The Trader Column, November 21, 2020
For the last 6 weeks of 2020, I expect markets to trade on on the premise that a vaccine means a reopening and the beginning of a return to normal in 2021. I am calling this “The Vaccine Put”. (For years investors have referred to “The Fed Put” as protecting them from downside as the Fed continually steps in to prop up the market when trouble arises).
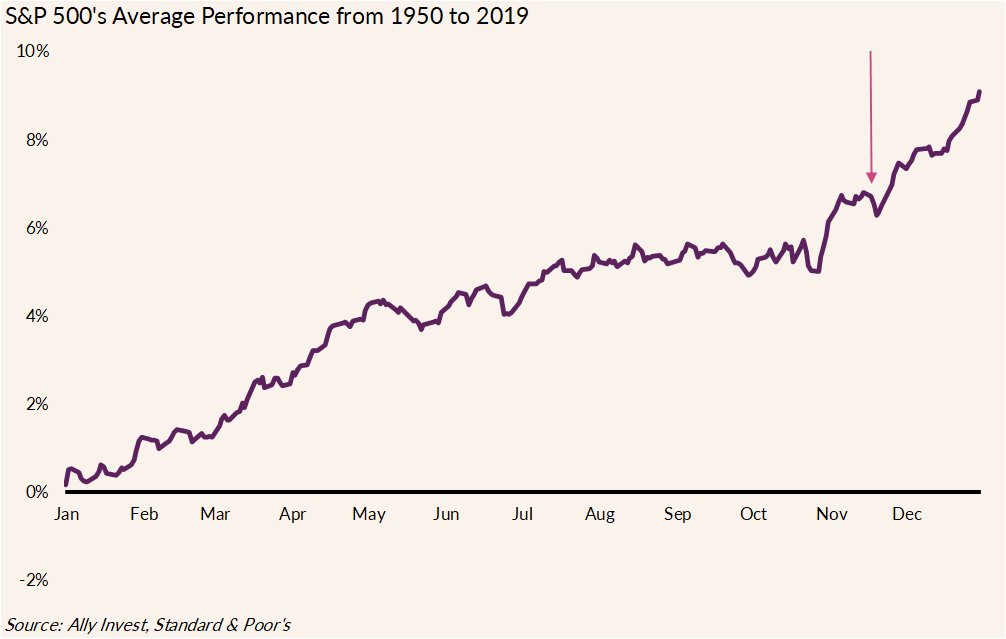
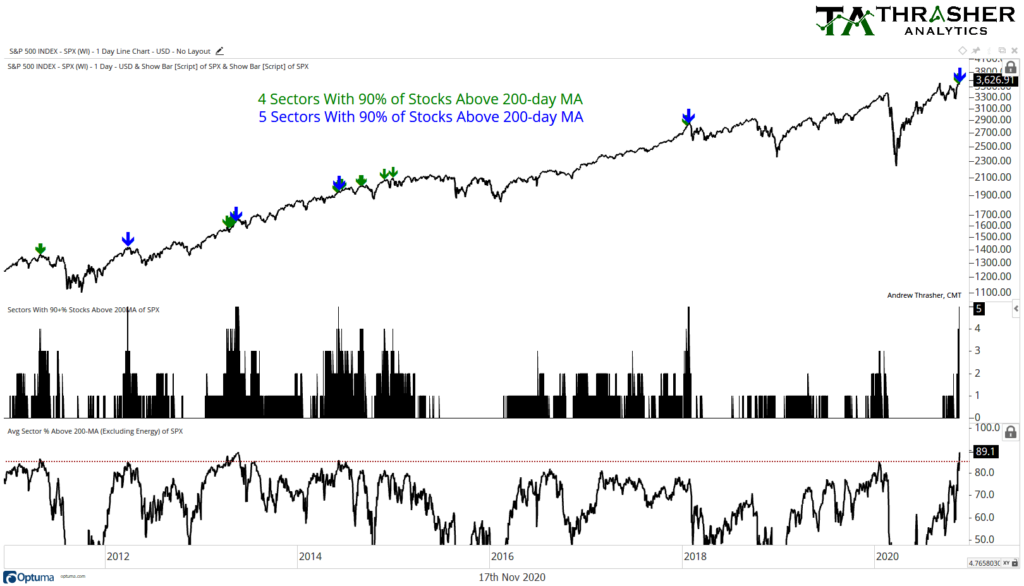
In addition to the bullish narrative, we are in the most seasonably bullish period of the year, a data light stretch in which the bullish narrative is likely to cause stocks to drift higher into year end (after a small correction that I’ve been writing about based on Andrew Thrasher’s argument that the market is currently too strong).
I have already discussed how I intend to trade this in recent morning emails.
History doesn’t repeat itself but it often rhymes – Mark Twain
I started studying the parallels between the current market rally and the bear market rally of 1929-1930 early on. After peaking at 381.17 on 9/3/29, the Dow Jones Industrial Average started to slide and then crash, bottoming on 11/13/29 at 198.69, a 48% decline in a little over two months. The current market peaked on 2/19/20 at 3386.15 and then crashed for a month (“The COVID Crash”) bottoming at 2237.40 on 3/23/20, a 34% decline.
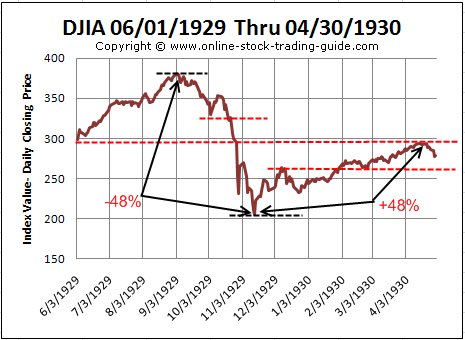
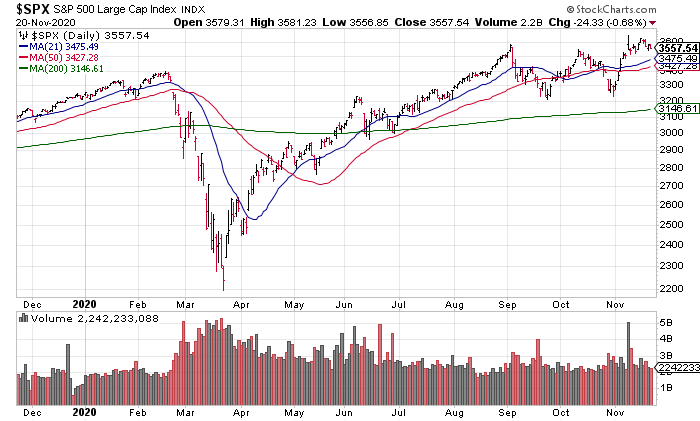
This time around, the crash was shallower as the Fed’s policy response was swift and strong, unlike in 1929. That also accounts for the increased magnitude of the current rally in my opinion. From 11/13/29, the market rallied for 5+ months reaching 294.07 on 4/17/20, a 48% increase. The meat of the current rally also lasted a little more than 5 months, reaching 3580.84 on 9/2/20, a 60% increase to new highs. Because of the Fed’s swift and strong policy response this time around, it was able to arrest the decline and reignite the bull market to new highs. If history is any guide however, and the chart suggests we are topping out, I expect the bear market to begin in early 2021.
In this weekend’s WSJ, in his Intelligent Investor column, Jason Zweig denied that the stock market was in a bubble citing a 21x forward P/E ratio. Unfortunately, that is the wrong metric to use as it is based on overly optimistic analyst assumptions. Both Jim Stack’s Investech Newsletters, which cites the market’s trailing 12 month P/E ratio, based on earnings that have already occurred, at 36.17, along with a number of other metrics including the Price / Sales ratio and the Buffett Indicator and Crescat Capital’s Valuation Model suggest this is in fact the most expensive market in history i.e. a bubble.
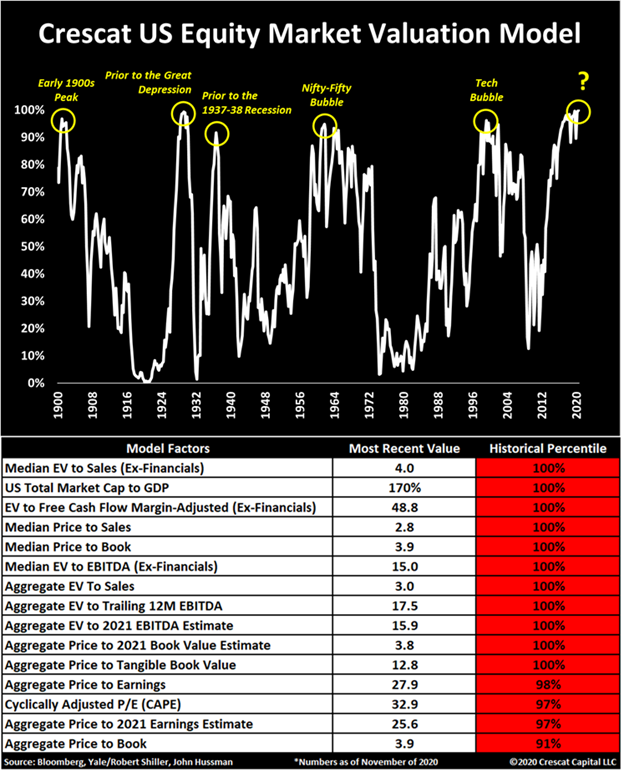
Those of you who follow me on Stocktwits and/or Twitter know that I have been going through stocks meticulously during 3Q Earnings Season, pointing out their overvaluation one by one. Last week, I showed this with regard to WMT, HD, NVDA & WDAY, none of which could get any traction off of good to great quarters.
May you live in interesting times – a Chinese Curse
