As Bullish As Bullish Gets, The Philosophical Foundation of Contrarianism & How It Applies Now, Case Study in Overvaluation: NKE
Note: To sign up to be alerted when the morning blog is posted to my website, enter your name and email in the box in the right hand corner titled “New Post Announcements”. That will add you to my AWeber list. Each email from AWeber has a link at the bottom to “Unsubscribe” making it easy to do so should you no longer wish to receive the emails.
In order to free up time tomorrow for other work, I’m going to write Monday’s morning market blog this morning. I don’t see anything changing between now and then anyways.
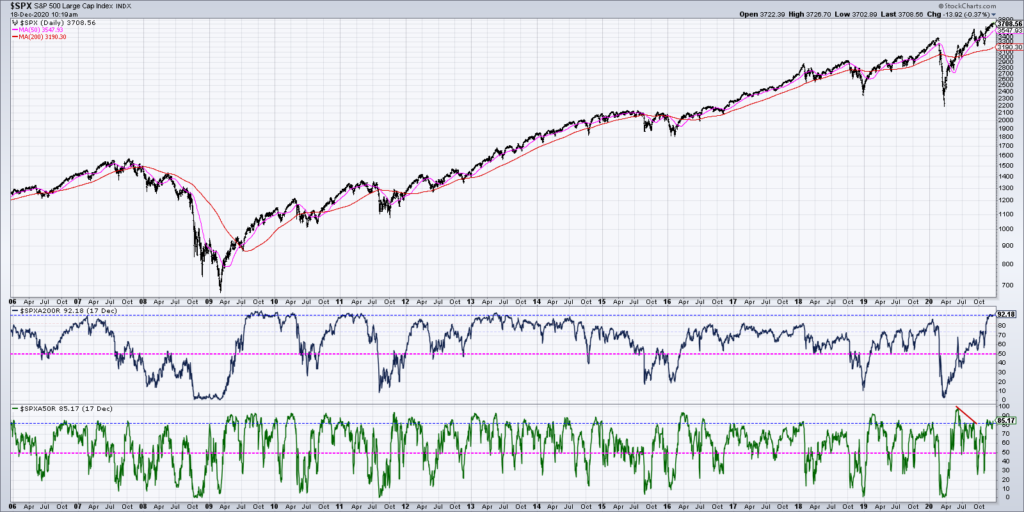
I have never seen breadth and sentiment as bullish as they currently are. Let’s start with breadth. According to a chart by David Keller, 92% of S&P components were above their 200 DMAs at 7:19am PST Friday morning (Chart Source: David Keller CMT Twitter, Friday December 18 7:19am PST). If we do the math, that means ~460 S&P stocks were above their 200 DMA and only ~40 below it. That’s some strong breadth.
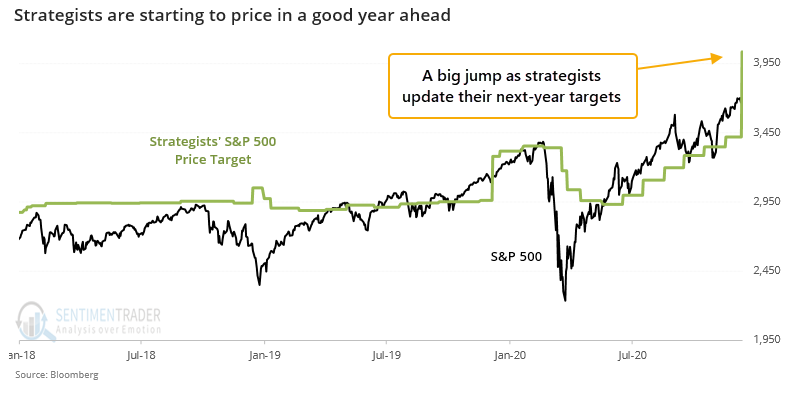
Turning to sentiment, let’s start with “The Biggest Consensus In History” (“The Biggest Consensus In History”, Top Gun Financial, Saturday December 19, Section 1). Investors are almost unanimous in their belief that 2021 will be a great year for stocks based on the COVID vaccines, economic reopening and normalization, That is the narrative driving stock prices since Pfizer’s vaccine announcement Monday November 9. You can see it in strategists rush to raise their 2021 S&P price targets in recent weeks (Chart Source: Sentimentrader, “Wall Streets looks set to party in ’21”, Friday December 18).
Next, in their monthly Fund Manager Survey, Bank of America found that fund managers were underweight cash for the first time since 2013 (Chart Source: “Investors Are Underweight Cash, First Time Since 2013”, JC Parets, Friday December 18).
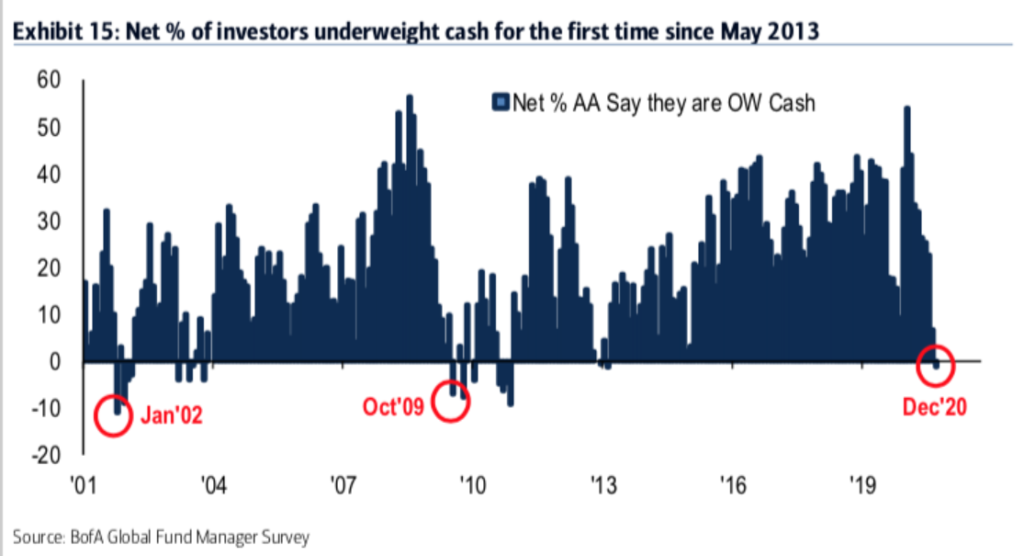
To Parets, this is bullish because it’s exactly what we saw at the beginning of the last two bull markets in Jan 2002 and October 2009:
So what’s that mean to us?
Well, as BofA points out here “this behavior is indicative of an early-stage recovery similar to recoveries after the GFC (Oct ’09) and the dot com bubble (Jan ’02)”.
It’s similar to all the breadth thrusts we’re seeing in the indexes, they typically come near the beginning of cyclical bull markets, not near the end of them.
Add this one to the list.
However, that’s not the conclusion drawn by BofA’s Chief Investment Strategist Michael Hartnett who said that this low level of cash is a sell signal that typically leads to a 3.2% correction in the S&P over the next month. “Sell the vaccine 1Q21”, Hartnett concluded (“Fund Manager Cash Hits 4% (BofA)”, Top Gun Financial, Wednesday December 16, Section 3).
Based on JC’s quote, maybe BofA is bearish short term but bullish long term. However, logically, low cash levels are not bullish because it means that fund managers are already fully invested without dry powder to buy stocks and push them higher.
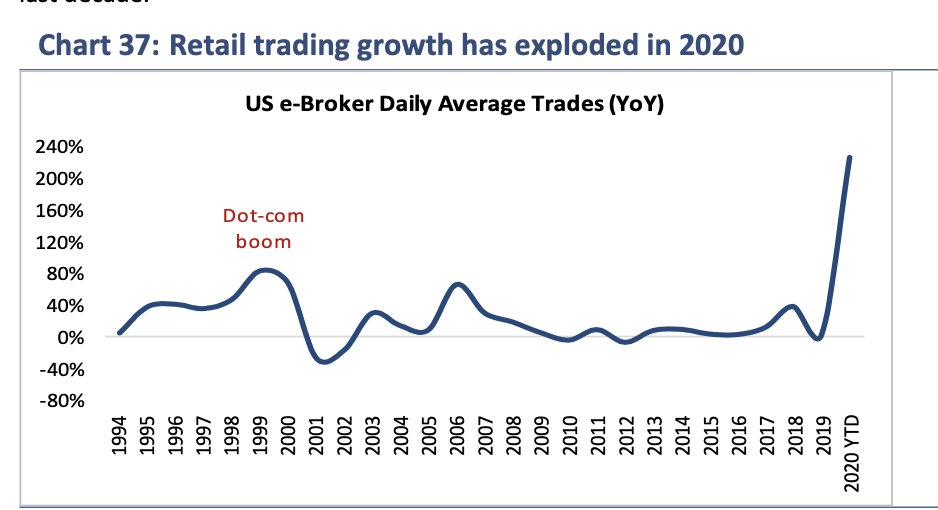
Retail is also All-In with trading volumes at E-Brokerages exploding in 2020 (Source: Callum Thomas Stocktwits, Saturday December 18, 12:41pm PST).
In addition to being All-In, investors see little reason to hedge their positions since “stocks only go up” (Chart Source: Callum Thomas Stocktwits via Sentimentrader, Saturday December 19, 12:29pm PST).
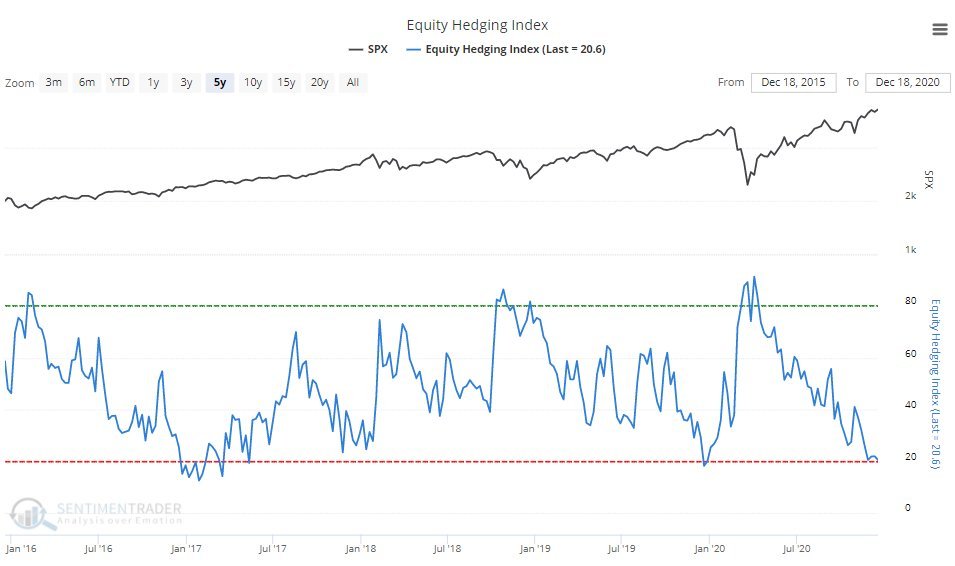
Summarizing: Almost every stock in the S&P 500 is above its 200 DMA while institutional and retail investor are All-In and feeling little need to hedge. That’s as bullish as bullish gets.
What great contrarians understand is that the broad consensus of bullish breadth and sentiment alone is not bearish – Aaron Jackson (“Investors are bulled up. For good reasons”, December 6)
It’s a nice sentence, and it’s true, but unfortunately it’s a Straw Man: investors that look at technicals and sentiment alone are unanimously bullish (see “The Technicians Are Unanimously Bullish”, Top Gun Financial, December 8, Section 1).
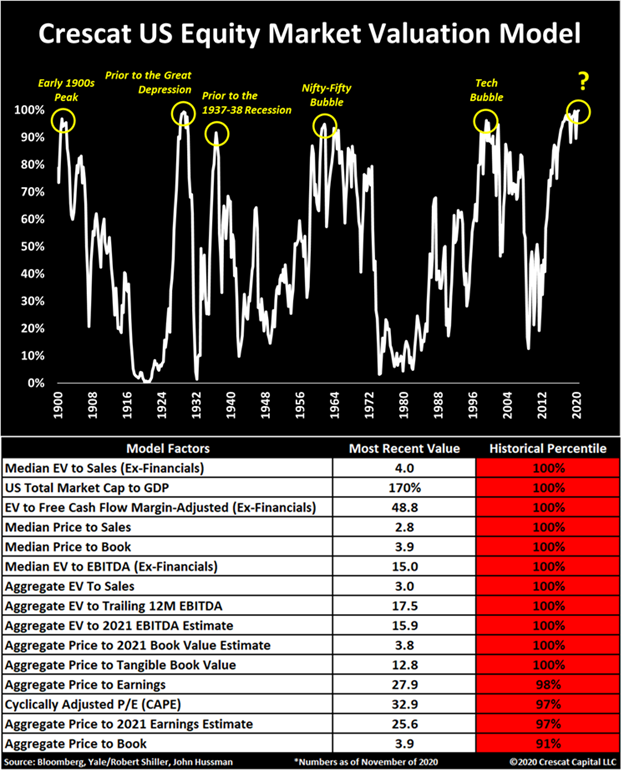
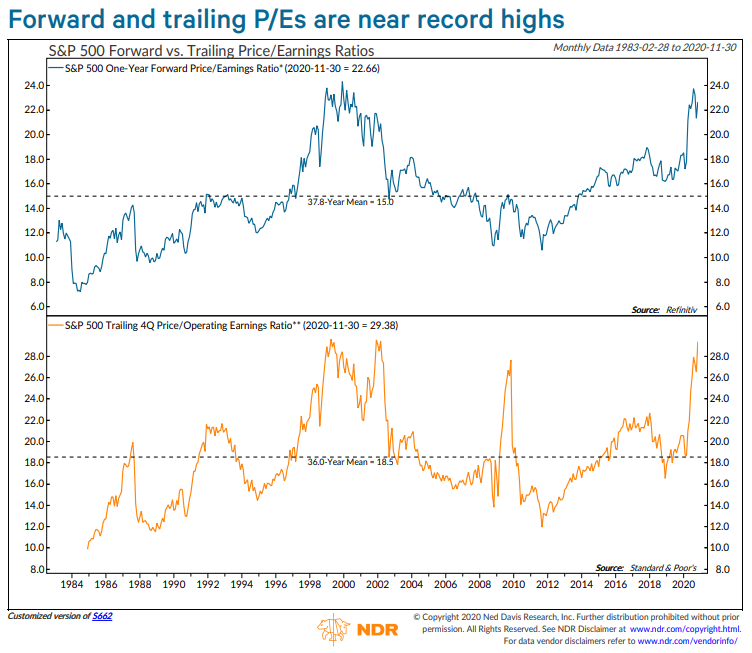
Investors that are bearish add in another metric: Valuation. These investors make a distinction between price and value that a technician like Jackson does not (see Top Gun Financial, “The Two Perennial Investment Philosophies”, Friday December 18, Section 2). Based on that distinction, unavailable to the pure technician Jackson who believes that “Price is truth”, some investors see a growing disconnect between price and value that has them bearish (1st Chart Source: Crescat November Research Letter, November 22; 2nd Chart Source: Ed Clissold Twitter Thread, Friday December 11).
Mr. Jackson should stick to analyzing charts and not talk about a contrarianism his investment philosophy denies him or, being the most conventional of thinkers, use the term “great”.
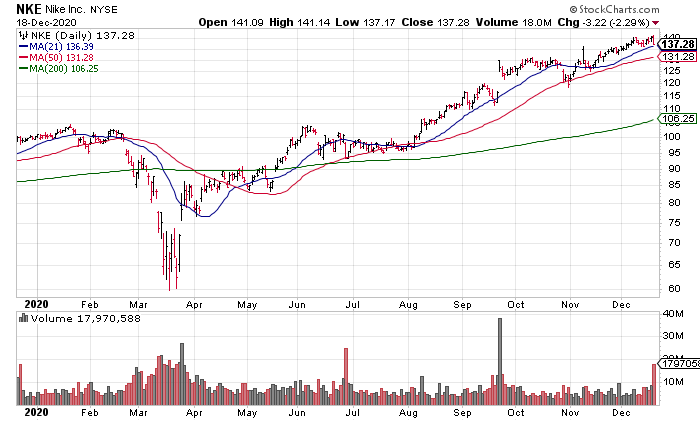
Conveniently, Nike (NKE, $221 billion market cap) reported earnings Friday morning and provides a perfect example of the rampant overvaluation currently prevailing in the stock market. The quarter was fine with Revenue +9% and EPS +11% to 78 cents. However, with the stock priced for perfection at an ATH of $140.50 at Thursday’s close, shares sold off 2.29% on more than 2x average volume on Friday. Even so, NKE is still trading for 33x trailing twelve month (TTM) EPS – even when we exclude their fiscal year 4th quarter ended May 31, 2020 in which their business was hard hit by the worldwide lockdowns. A fair multiple would be ~18x IMO giving NKE a fair value of $75 to $76 – 45% below Friday’s closing price of $137.28.
